Note
Go to the end to download the full example code.
Postprocessing simulation results using the MeshObjectPlot class#
The Visualization Interface Tool provides the MeshObject helper class to relate a custom object.
With a custom object, you can take advantage of the full potential of the Visualization Interface Tool.
This example shows how to use the MeshObjectPlot class to plot your custom objects with scalar data on mesh.
Necessary imports#
from ansys.fluent.core import examples
import pyvista as pv

from ansys.tools.visualization_interface.backends.pyvista import PyVistaBackend
from ansys.tools.visualization_interface import MeshObjectPlot, Plotter
Download the VTK file#
A VTK dataset can be produced utilizing PyDPF for Ansys Flagship products simulations results file format.
mixing_elbow_file_src = examples.download_file("mixing_elbow.vtk", "result_files/fluent-mixing_elbow_steady-state")
Define a custom object class#
Note that the CustomObject class must have a way to get the mesh
and a name or ID.
class CustomObject:
    def __init__(self):
        self.name = "CustomObject"
        self.mesh = pv.read(mixing_elbow_file_src)

    def get_mesh(self):
        return self.mesh

    def get_field_array_info(self):
        return self.mesh.array_names

    def name(self):
        return self.name


# Create a custom object
custom_vtk = CustomObject()
Create a MeshObjectPlot instance#
mesh_object = MeshObjectPlot(custom_vtk, custom_vtk.get_mesh())

# Define the camera position
cpos = (
    (-0.3331763564757694, 0.08802797061044923, -1.055269197114142),
    (0.08813476356878325, -0.03975174212669032, -0.012819952697089087),
    (0.045604530283921085, 0.9935979348314435, 0.10336039239608838),
)
Get the available field data arrays#
field_data_arrays = custom_vtk.get_field_array_info()
print(f"Field data arrays: {field_data_arrays}")
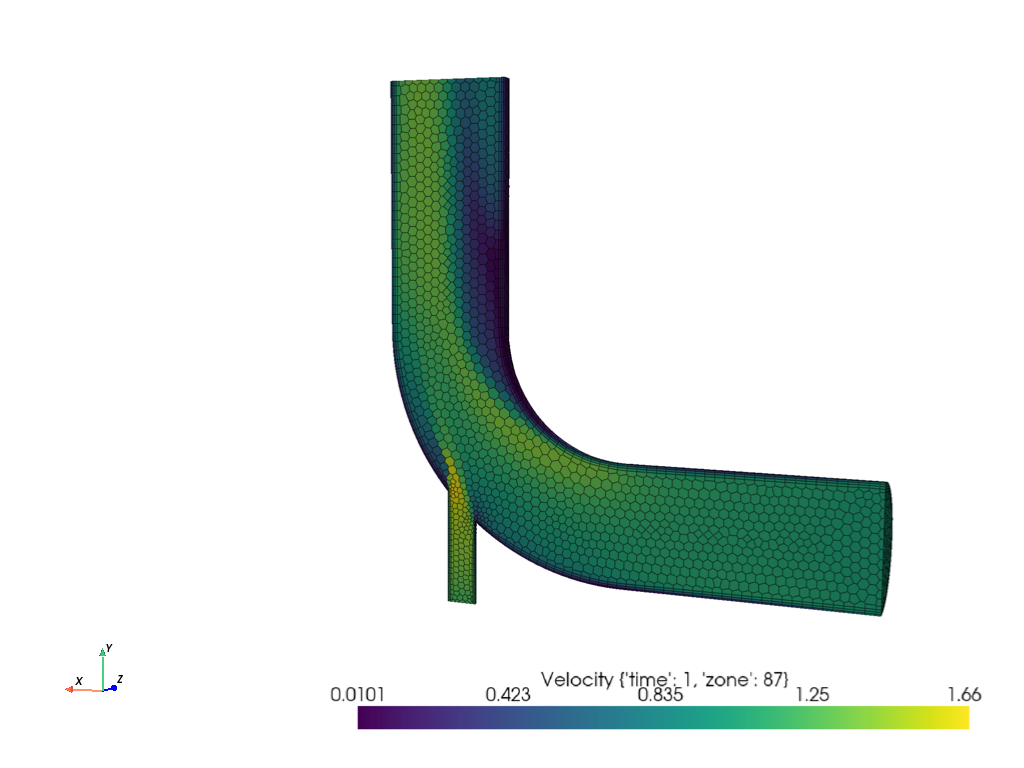
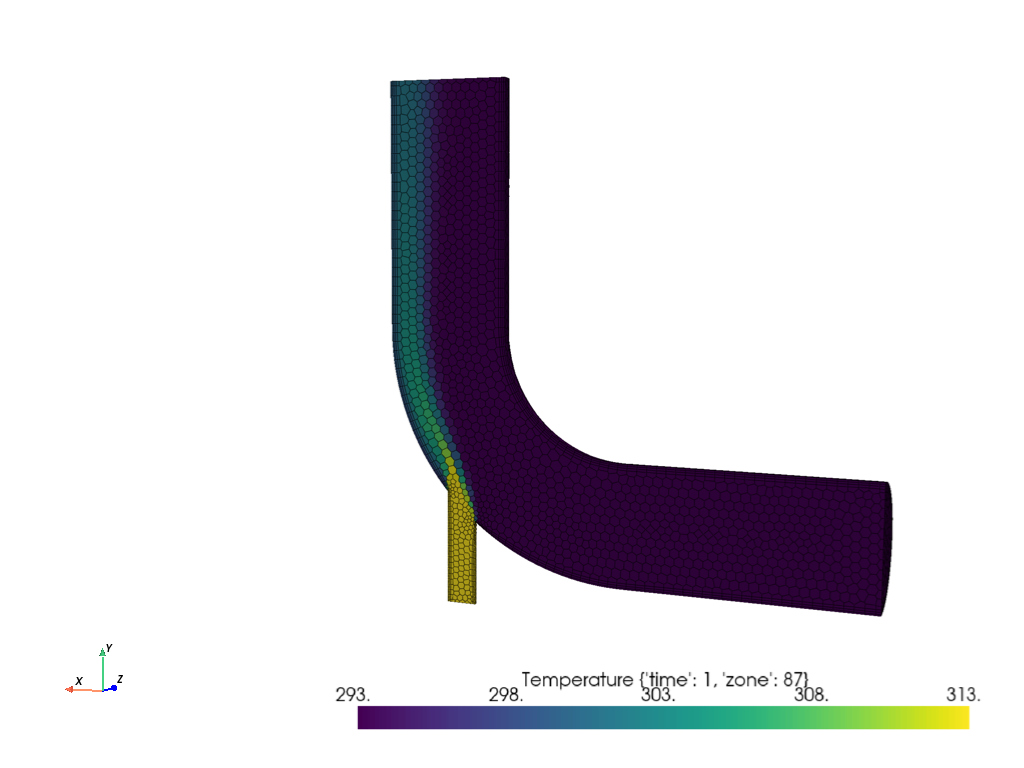
Field data arrays: ["Velocity {'time': 1, 'zone': 87}", "Temperature {'time': 1, 'zone': 87}"]
Plot the MeshObjectPlot instance with mesh object & field data (0)#
pv_backend = PyVistaBackend()
pl = Plotter(backend=pv_backend)
pl.plot(
    mesh_object,
    scalars=field_data_arrays[0],
    show_edges=True,
    show_scalar_bar=True,
)
pl._backend.pv_interface.scene.camera_position = cpos
pl.show()
[]
Plot the MeshObjectPlot instance with mesh object & other field data (1)#
pv_backend = PyVistaBackend()
pl = Plotter(backend=pv_backend)
pl.plot(
    mesh_object,
    scalars=field_data_arrays[1],
    show_edges=True,
    show_scalar_bar=True,
)
pl._backend.pv_interface.scene.camera_position = cpos
pl.show()
[]
Total running time of the script: (0 minutes 6.994 seconds)