Note
Go to the end to download the full example code.
Animation Example#
This example demonstrates how to create and display animations for time-series simulation data using the PyVista backend.
import numpy as np
import pyvista as pv

from ansys.tools.visualization_interface import Plotter
Create sample animation data#
Generate a series of meshes representing a wave propagation over time.
def create_wave_mesh(time_step, n_points=50):
    """Create a mesh with a wave pattern for a given time step."""
    # Create grid
    x = np.linspace(-5, 5, n_points)
    y = np.linspace(-5, 5, n_points)
    x, y = np.meshgrid(x, y)

    # Create wave pattern that evolves over time
    t = time_step * 0.2
    z = np.sin(np.sqrt(x**2 + y**2) - t) * np.exp(-0.1 * np.sqrt(x**2 + y**2))

    # Create structured grid
    mesh = pv.StructuredGrid(x, y, z)
    mesh["displacement"] = np.abs(z).ravel()

    return mesh


# Create 30 frames
frames = [create_wave_mesh(i) for i in range(30)]
Display animation with interactive controls#
Create and show an animation with play/pause, stop, and frame navigation.
plotter = Plotter()
animation = plotter.animate(
    frames,
    fps=20,
    loop=True,
    scalar_bar_args={"title": "Displacement"}
)

# Display with interactive controls
animation.show()
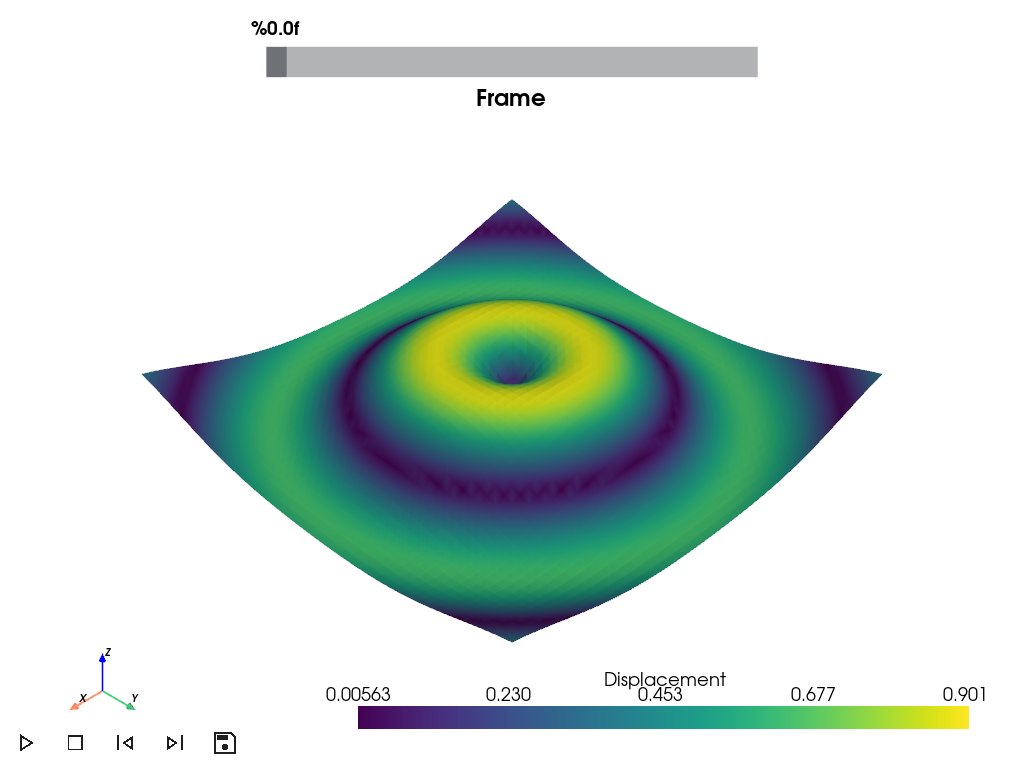
Interactive Controls#
The animation window includes the following controls:
Play/Pause button (green): Start/stop animation playback
Stop button (red): Reset to first frame
Previous/Next buttons (blue): Step through frames manually
Save GIF button (orange): Export animation (requires imageio)
Frame slider (top): Jump to any frame
You can rotate, zoom, and pan the view while the animation plays.
Total running time of the script: (0 minutes 0.780 seconds)