Note
Go to the end to download the full example code.
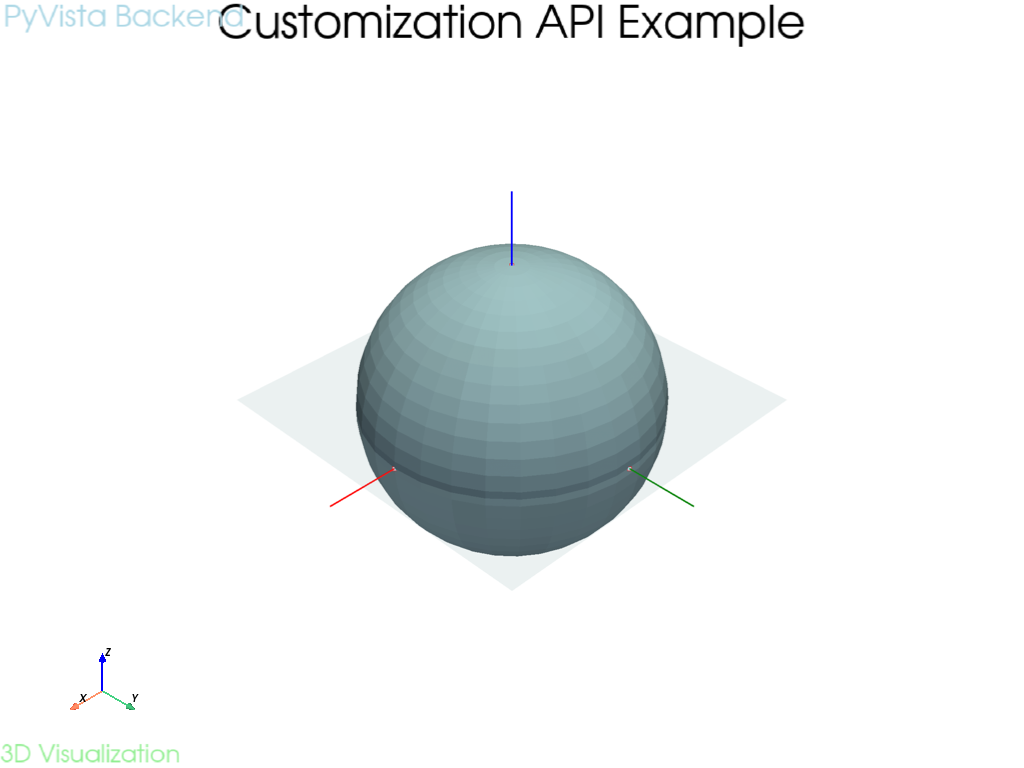
Customization API example#
This example demonstrates how to use the customization API of the visualization interface to add various elements to a PyVista scene, such as points, lines, planes, and text annotations. The example also shows how to plot a simple sphere mesh and customize its appearance.
/home/runner/work/ansys-tools-visualization-interface/ansys-tools-visualization-interface/.venv/lib/python3.14/site-packages/ansys/tools/visualization_interface/backends/pyvista/pyvista.py:802: UserWarning: Points is not a float type. This can cause issues when transforming or applying filters. Casting to ``np.float32``. Disable this by passing ``force_float=False``.
  point_cloud = pv.PolyData(points_array)
/home/runner/work/ansys-tools-visualization-interface/ansys-tools-visualization-interface/.venv/lib/python3.14/site-packages/ansys/tools/visualization_interface/backends/pyvista/pyvista.py:1015: UserWarning: Points is not a float type. This can cause issues when transforming or applying filters. Casting to ``np.float32``. Disable this by passing ``force_float=False``.
  point_cloud = pv.PolyData(points_array)

[]
from ansys.tools.visualization_interface import Plotter
import pyvista as pv

# Create a plotter using the Plotly backend and add basic geometry.

plotter = Plotter()

# Add a sphere - this works fine
sphere = pv.Sphere(radius=1.0, center=(0, 0, 0))
plotter.plot(sphere)


# Add point markers to highlight specific locations.

key_points = [
    [1, 0, 0],   # Point on X axis
    [0, 1, 0],   # Point on Y axis
    [0, 0, 1],   # Point on Z axis
]

plotter.add_points(key_points, color='red', size=10)

# Add line segments to show coordinate axes.

# X axis
x_axis = [[0, 0, 0], [1.5, 0, 0]]
plotter.add_lines(x_axis, color='red', width=4.0)

# Y axis
y_axis = [[0, 0, 0], [0, 1.5, 0]]
plotter.add_lines(y_axis, color='green', width=4.0)

# Z axis
z_axis = [[0, 0, 0], [0, 0, 1.5]]
plotter.add_lines(z_axis, color='blue', width=4.0)


# Add a plane to show a reference surface.

plotter.add_planes(
    center=(0, 0, 0),
    normal=(0, 0, 1),
    i_size=2.5,
    j_size=2.5,
    color='lightblue',
    opacity=0.2
)


# Scene title at the top center
plotter.add_text("Customization API Example", position="upper_edge", font_size=18, color='black')

# Additional labels at the top left corner using a string for the position as before
plotter.add_text("PyVista Backend", position="upper_left", font_size=12, color='lightblue')
# Additional labels at the bottom left corner using pixel coordinates
plotter.add_text("3D Visualization", position=(0.95, 0.95), font_size=12, color='lightgreen')


# Add labels at specific 3D points to annotate key locations in space.

label_points = [
    [1, 0, 0],   # X axis endpoint
    [0, 1, 0],   # Y axis endpoint
    [0, 0, 1],   # Z axis endpoint
]

labels = ['X-axis', 'Y-axis', 'Z-axis']

plotter.add_labels(label_points, labels, font_size=16, point_size=8.0)


# The clear() method resets the plotter and can be called even after show().
# This allows reusing the same plotter for multiple visualizations.

# Uncomment to clear everything added above and start fresh:
# plotter.show()
# plotter.clear()
# plotter.plot(pv.Cube())  # Would show only a cube instead


# Display the visualization with all customizations.

plotter.show()
Total running time of the script: (0 minutes 0.407 seconds)